PANG: Pattern-Based Anomaly Detection in Graphs

7 December 2023

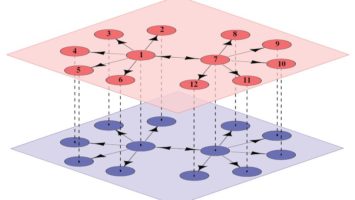
Pang (Pattern-Based Anomaly Detection in Graphs) is an algorithm which represents and classifies a collection of graphs according to their frequent patterns (subgraphs). The detail of this algorithm are described in the below article. This work was conducted in the framework of the DeCoMaP ANR project (Detection of corruption in public procurement markets — ANR-19-CE38-0004). Plus d'infos

Abuse Detection in Online Conversations

4 December 2023

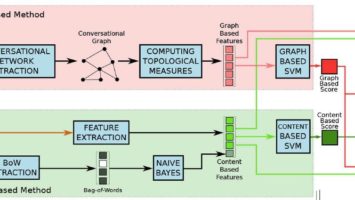
This software was designed to detect abusive messages in online conversations. Two main approaches are implemented: a content-based approach and a graph-based approach, which can also be used jointly. This software was applied to a corpus of chat messages written in French, which unfortunately cannot be published due to legal matters. The conversational graphs extracted from this text are publicly available on Zenodo, though.

Simulator of a propagation process in graphs

29 July 2023

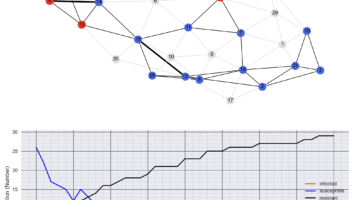
This software, developed in Python as part of Oumaima DIAMI’s Master 2 internship, allows for observing the dynamics of a propagation process in a graph. Various control policies (Intrusion Detection Systems) can be tested, as well as different types of propagation (unicast, broadcast, random, etc.). The software enables real-time visualization of the different states of nodes as the propagation progresses. A graph also allows for viewing the temporal evolution of the propagation process. Finally, various types of networks can be generated: random, ER, or small-world.

Social Network of Emperor Trajan

4 December 2020

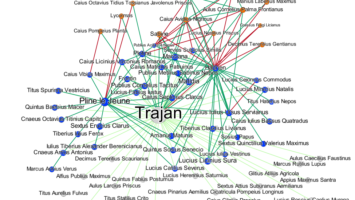
These scripts aim at analyzing a historical dataset describing the relationships between Roman emperor Trajan and his entourage. It does the following:

Multiple Partitioning of Multiplex Signed Networks

4 December 2019

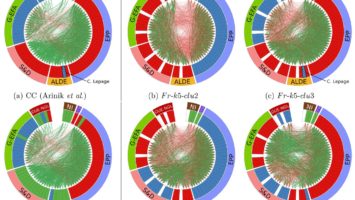
These scripts were designed to analyze the European Parliament votes through a multiplex network-based approach. Our tool was applied to data representing the activity of the members of the European Parliament (MEPs) during the 7th term (from June 2009 to June 2014). The raw data describing this activity were retrieved from the It’s Your Parliament website. There were some minor issues with these data, which we had to correct: some MEPs were represented twice, some profiles were incomplete, the policy domains were not defined for all vote texts, etc. These cleaned data, as well as our figures and results, are available on Zenodo.

Random generation of signed graphs

3 December 2018

These scripts were designed to randomly generate signed graphs possessing some form of community structure, in order to assess partitioning algorithms. Various aspects of the graphs can be specified by the user.

Web-based event detection for political science

3 December 2018

This software takes the name of a public person and a period, and retrieve all events available online involving this person during this period. It first performs a Web search using various engines, then retrieves the corresponding Web pages, performs NER (named entity recognition), uses these entities to cluster the articles, and considers each cluster as the description of a specific event. It is designed to handle Web pages in French, but should work also for English.

Extraction and partition of voting networks

2 December 2018

These were designed for three purposes: Generate a variety of plots and statistics based on some raw data describing the voting activity of a population. Extract so-called vote networks from these data. Perform various analyses on these networks, in particular: estimate good partitions of the network, according to different measures. Our tool was applied to data representing the activity of the members of the European Parliament (MEPs) during the 7th term (from June 2009 to June 2014), as described in [MFL’15a, MFL’15b]. The raw data describing this activity were first retrieved from the VoteWatch website. However, these data were incomplete, so we later switched to another source: the It’s Your Parliament website. There were also some minor issues with these data, which we had to correct: some MEPs were represented twice, some profiles were incomplete, the policy domains were not defined for all vote texts, etc. These cleaned data are available on Zenodo here and there. URL: https://github.com/CompNet/NetVotes Production date: 2014–2018 Related publications: Nejat Arınık, Rosa Figueiredo et Vincent Labatut. « Signed Graph Analysis for theInterpretation of Voting Behavior ». In : International Conference on Knowledge Technologiesand Data-driven Business (i-KNOW) – International Workshop on Social NetworkAnalysis and Digital Humanities (SnanDig). T. 2025. CEUR Workshop Proceedings.Graz, Plus d'infos

Straightness & Spatial graphs

3 December 2016

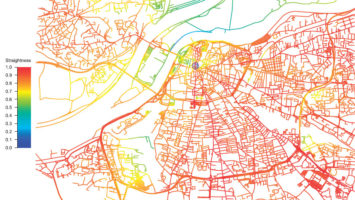
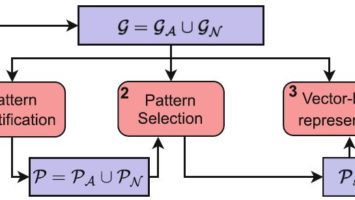
These scripts were designed to compute several variants of the Straightness (aka. Directness and probably other names): the ratio of the Euclidean to the graph distance. It is a measure designed to study spatial graphs, i.e. graphs embedded in a Euclidean space (nodes have spatial positions, links have spatial length, etc.). First, this toolbox can process the Straightness using the traditional approach, i.e. considering only paths connecting two nodes. It can process the Straightness between two specific nodes, or the Straightness averaged over certain pairs of nodes in the graph (possibly all of them). Second, this toolbox can also compute the average Straightness through a continuous approach (by opposition to the discrete traditional approach), and incidentally this is the point of the below article. URL: https://github.com/CompNet/SpatialMeasures Production date: 2016 Related publication:  Vincent Labatut. « Continuous Average Straightness in Spatial Graphs ». In : Journalof Complex Networks 6(2):269-296 (2018). DOI: 10.1093/comnet/cnx033. ⟨hal-01571212⟩

Opinion-based centrality measure for multiplex networks

3 December 2016

These scripts were designed for two purposes: Process the opinion centrality, a new centrality measure for multiplex networks. Compare it to other existing multiplex centrality measures. Our scripts were applied to a collection of multiplex networks obtained from public sources and provided in our GitHub project. The tool itself, the data and the experimental results are all described in the below article. URL: https://github.com/CompNet/MultiplexCentrality Production date: 2015–2016 Related publication:  Alexandre Reiffers et Vincent Labatut. « Opinion-based centrality in multiplexnetworks : A convex optimization approach ». In : Network Science 5(2):213-234 (2017). DOI: 10.1017/nws.2017.7. ⟨hal-01486629⟩  (cite this article if you use the software)

1 2